
Introduction
A dashboard is like a summary of important information you need to know, all in one place. It shows features like charts and lists to help you understand data at a glance.
In TeamTracks, you can make dashboards using features like charts, reports, and HTML templates. One or more dashboards can created under a track and each dashboard can have elements from any track from the team the track belong to. For example, you could have a chart from Track 1 and a report from Track 2 all on the same dashboard.
If a user does not have access to an element in a dashboard, an error message will be displayed for the element when the dashboard is loaded.
Steps to Create a Dashboard
Log in as an Admin.
Select Dashboards and click on "Create New."
Enter a Name and Description for your Dashboard.
You can hide the dashboard from the main left navigation bar on the Agent portal using Hide from navigation checkbox.
Add Display Items:
Click on the "+" icon to add Dashboard elements.
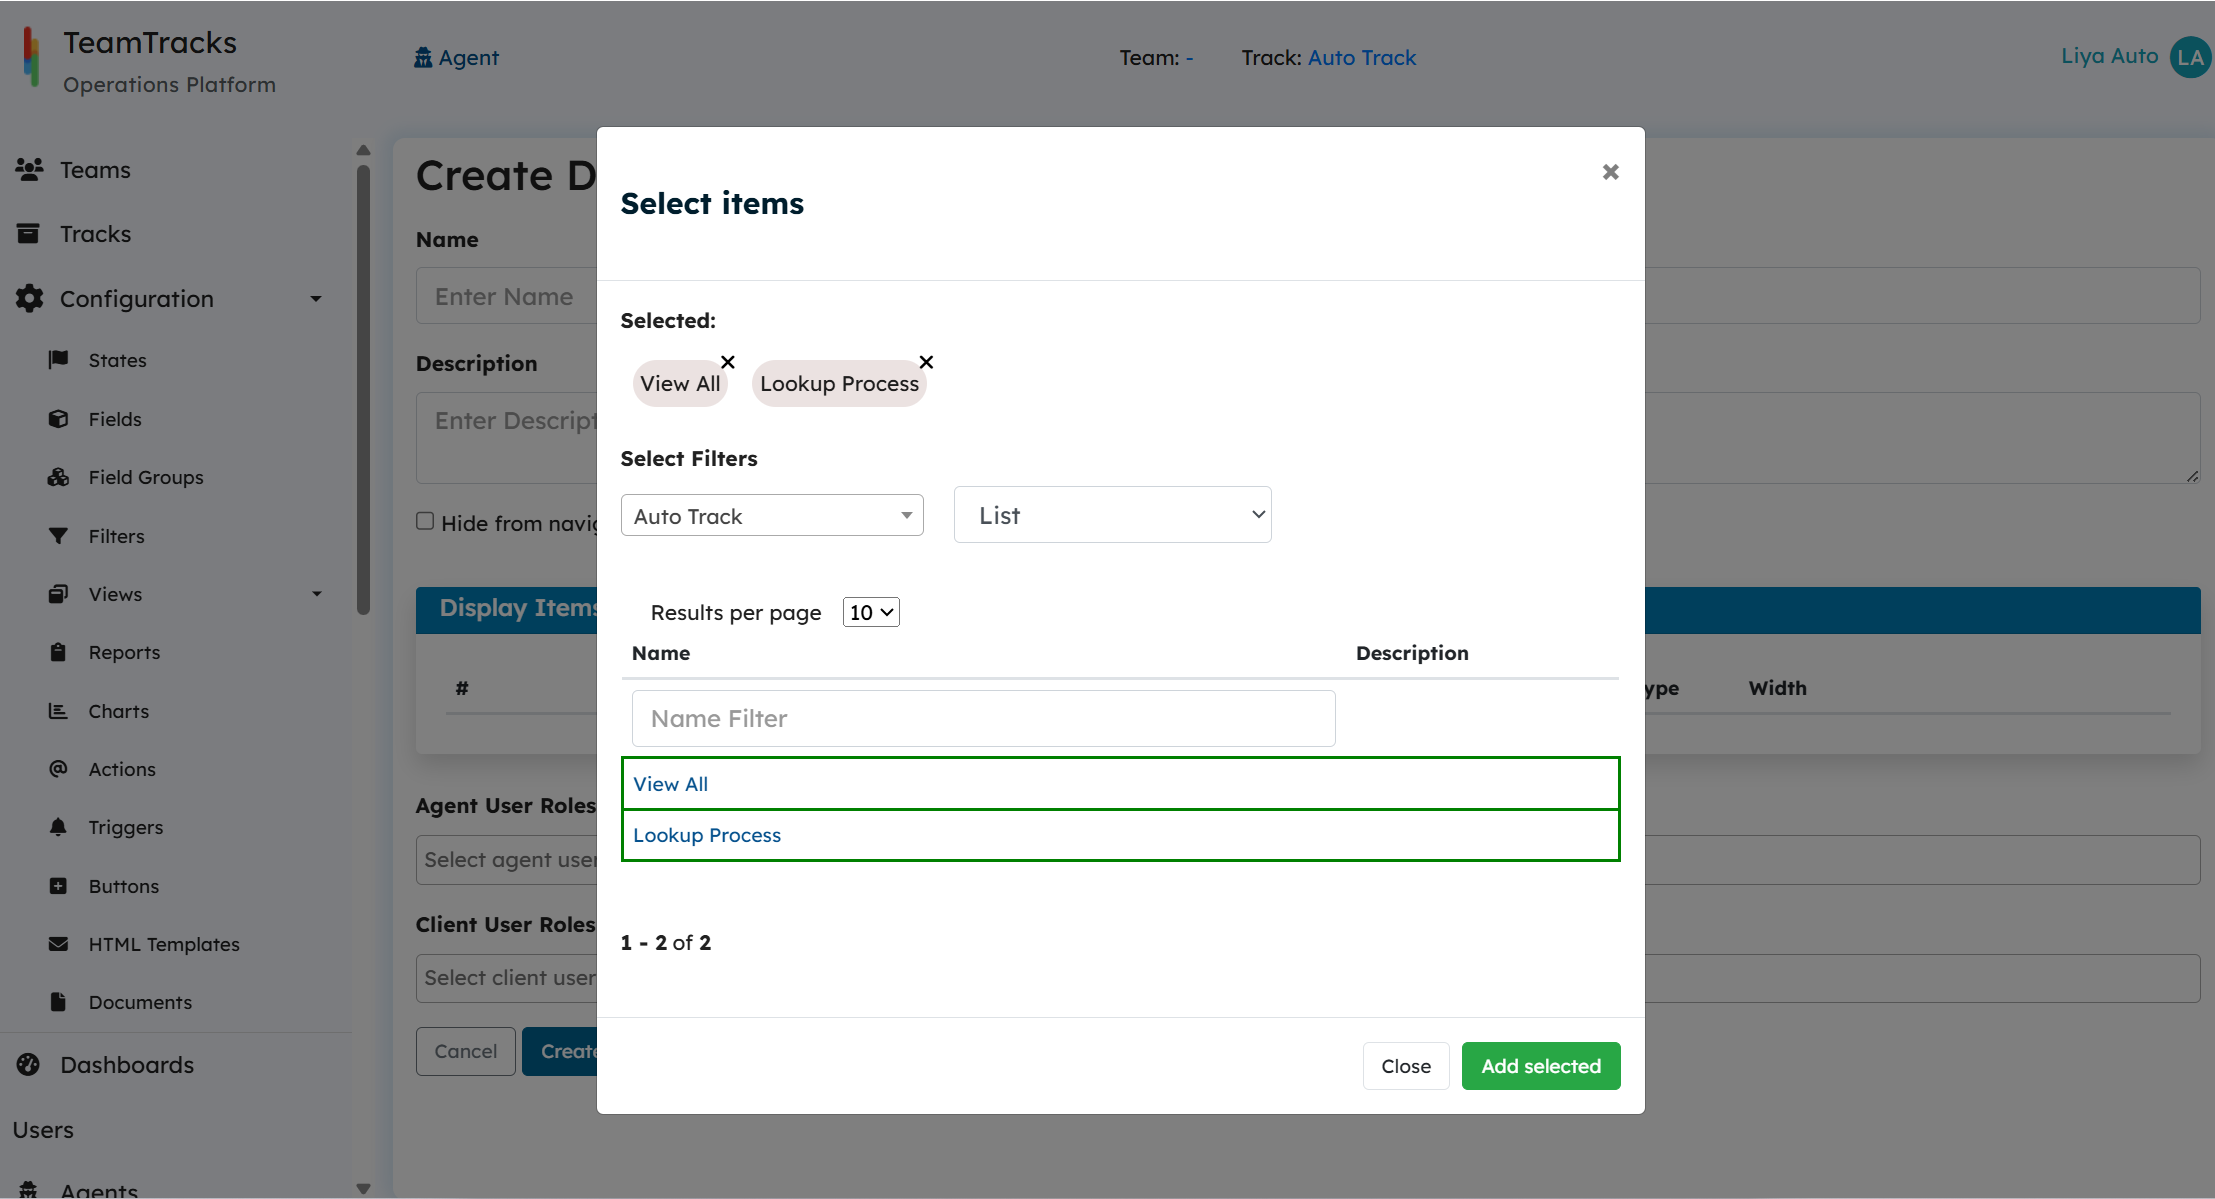
Select the Track using the first dropdown from which you want to choose the element.
Choose the Item Type from the second dropdown; it can be a chart, report, list, or a generic HTML template. Note that generic templates are common across all tracks, so you don't have to select the Track for them.
After selecting the Track and item type, the system will list the items that match the filter criteria.
Select the desired item and click on "Add Selected."
After selecting the display elements for the dashboard, you can customize them using the width feature. This allows you to specify how each item appears on the dashboard by defining its width. Options include full, one-quarter, half, one-third, three quarters and two-thirds widths for displaying the items.
Select the agent roles and client roles who need access to the report.
Click on Create.
.png)