
Introduction
Export as Image: Download charts as PNG files for presentations or reports.
In-Platform Analysis: Click the chart to see detailed data in a list view within TeamTracks.
Export Data for Analysis: Download chart data as CSV or Excel files for deeper analysis.
Charts also have full role-based access control, making it easy to manage who can see or use them. You can add extra security by adjusting view settings directly on the chart, which is helpful when working with sensitive data.
All charts have some general settings, along with additional options that vary depending on the chart type. With this feature, you can create five different types of charts:
Chart Type | Description |
|---|---|
Pie chart | Displays data as slices of a circle, showing parts of a whole. |
Bar chart | Uses rectangular bars to compare different categories or values. |
Line chart | Plots data points connected by lines, showing trends over time. |
Stacked bar chart | Shows parts of a whole within bars, stacking categories on top of each other. |
Card chart | Presents key statistics like sum, average, or count in a single, easy-to-read card format. |
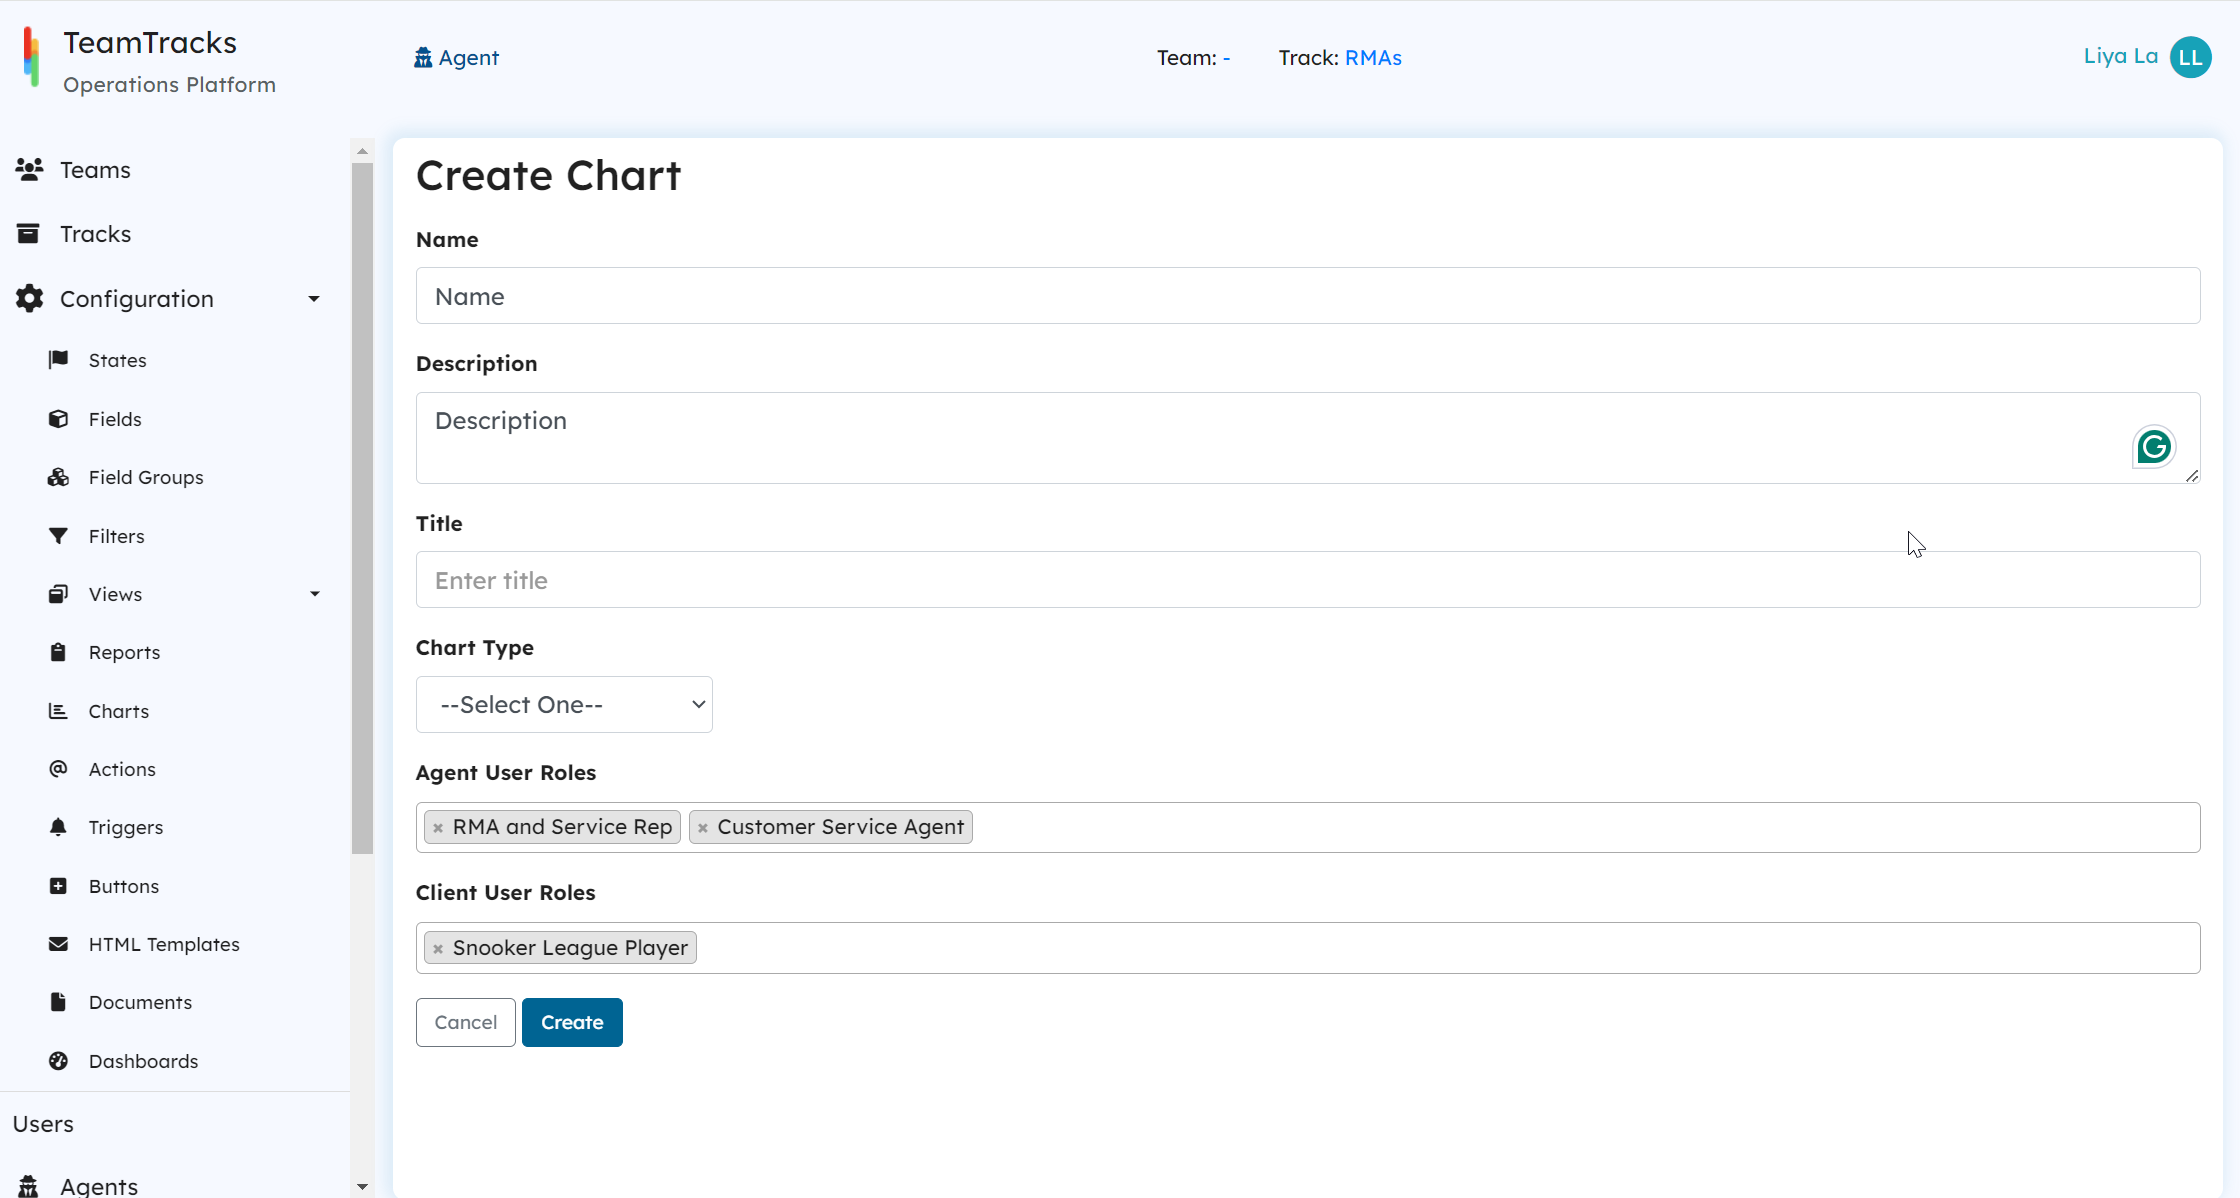
General Configuration
Provide a Name and a brief description for your chart.
Title: Add a suitable title or caption. If left blank, the chart's name will be used as the title.
Chart Type: Select the type of chart you want to create (e.g., Pie, Bar, Line, etc.).
User Roles: Choose the agent and client user roles that can access the chart.
 Admin Portal: Chart Configuration
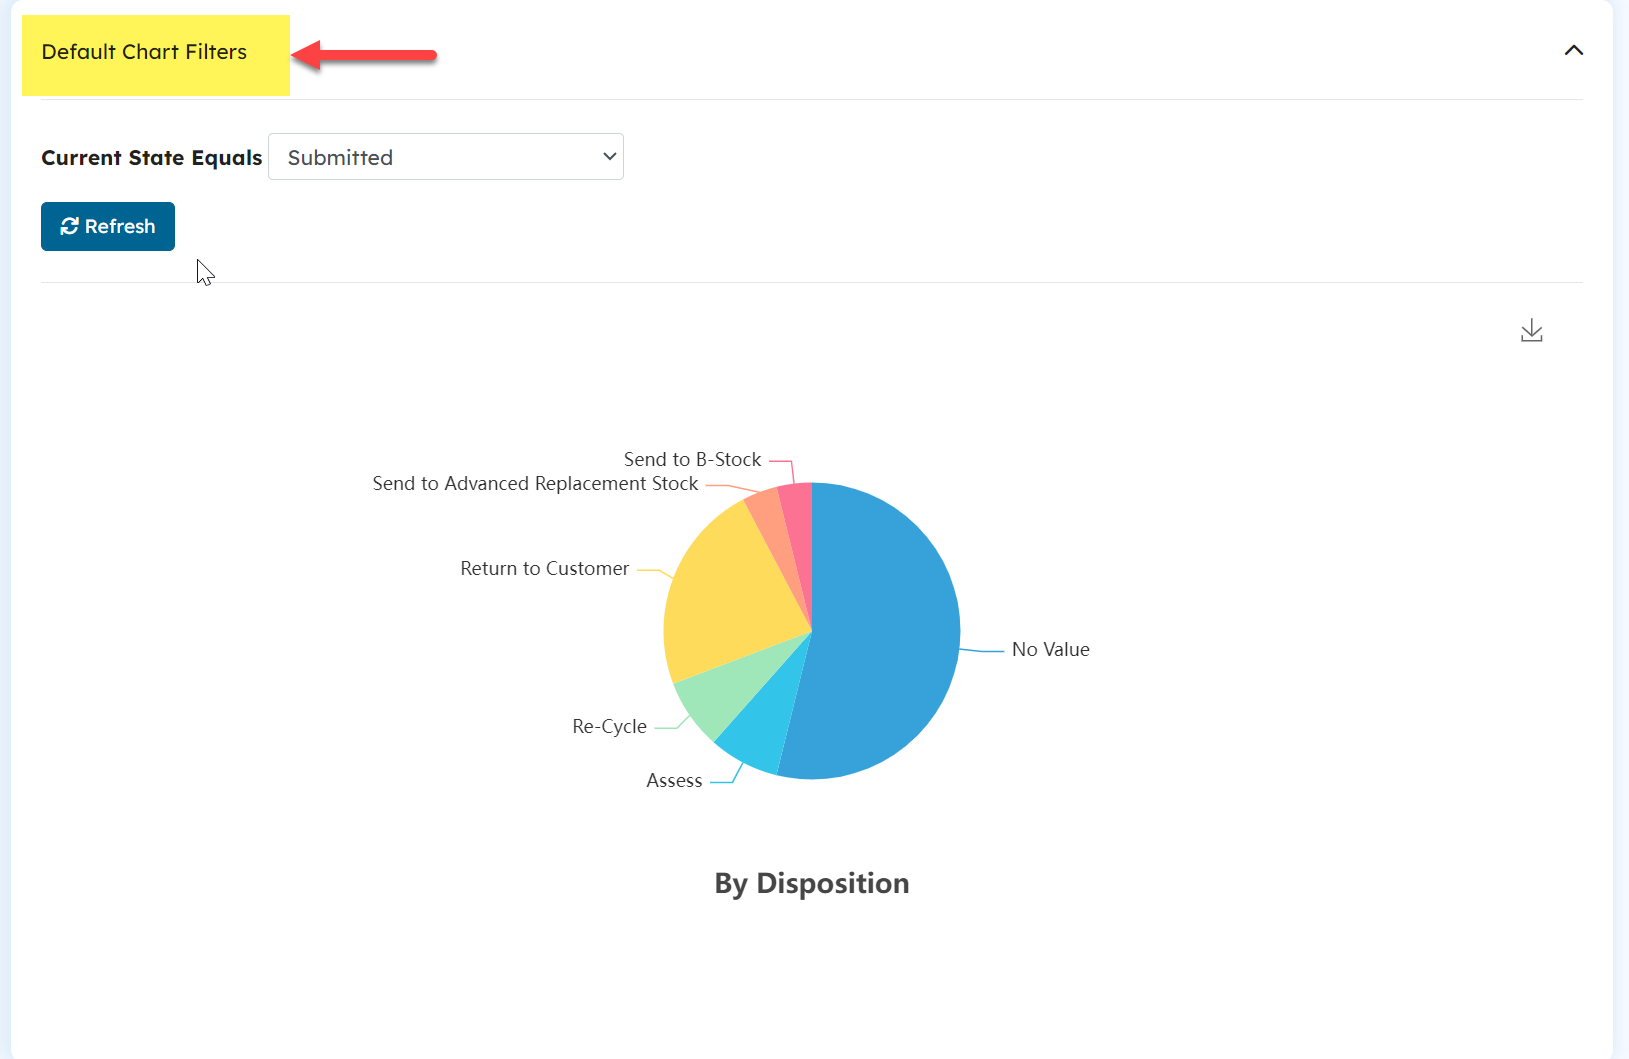
Filters
Filters are essential if you want to refine the data and generate a chart based on a specific criteria. This feature allows you to apply filters to the chart data, helping you focus on the information that matters most. To add filters, simply click the + icon and select from the available filters.
.png "image(40).png")
Admin Portal: Charts Settings
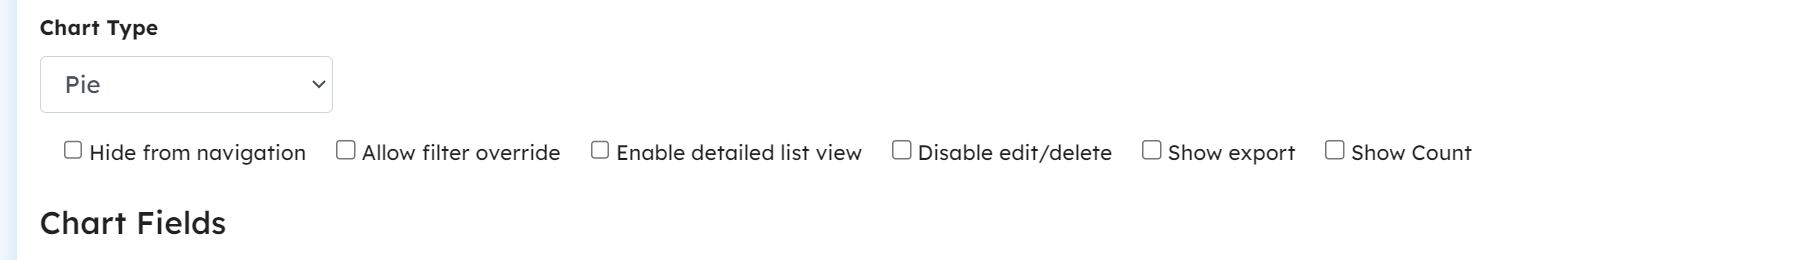
Other Functionalities
These features will appear once you select the chart type and are common across all charts. They provide consistent functionality regardless of the specific chart you choose to create.
Admin Portal: Chart Configuration
Theme
Six new colour themes are available for charts.
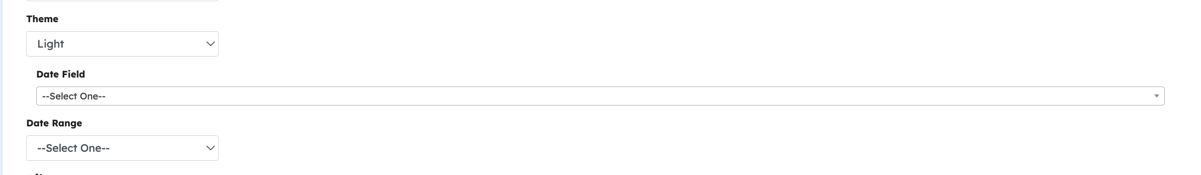
The themes are Light, Dark, Vintage, Macarons, Rainbow and Roma. See See Release notes for more info
Hide Navigation
This feature hides charts from the list on the navigation or home page. Enable this option if you don't want the chart to be directly accessible from the agent portal.
Allow Filter Override
This feature lets users override any existing filters applied to the charts, giving them the ability to apply their own custom filters. This is useful for flexible data exploration by adjusting the filters to focus on different aspects of data.
Agent Portal: Charts
Enable Details List View
This feature allows users to click on the chart and view a detailed report of the underlying data in a list format. This provides agents a way to explore the data at a more granular level.
When you enable the Detailed List View feature, a configuration section appears above the user roles settings. Here’s how to set it up:
List Fields: Choose which fields to display in this list by clicking the + icon.
Use the Default Sort By dropdown to sort the list in ascending or descending order. Select the field to sort by, then choose the order.
If you want to dive deeper into individual objects, you can add Display Views to the chart settings. This allows users to click on each list entry and access more detailed information about each object through the selected display view.
Note: Users must have access permissions to view the display views of the object.
.png "image(39).png")
Admin Interface: Chart Configuration
you can see below when a user clicks a chart, the data opens in a list view. If the Display Views are added, user can click on each individual record in the list for a more detailed view of each object.
Agent Portal: Charts
Disable Edit/Delete
This feature presents the detailed list view data in a read-only format, preventing agents from editing or deleting the data from the chart list.
Show Export
This feature allows agents to export the data in Excel or CSV format.
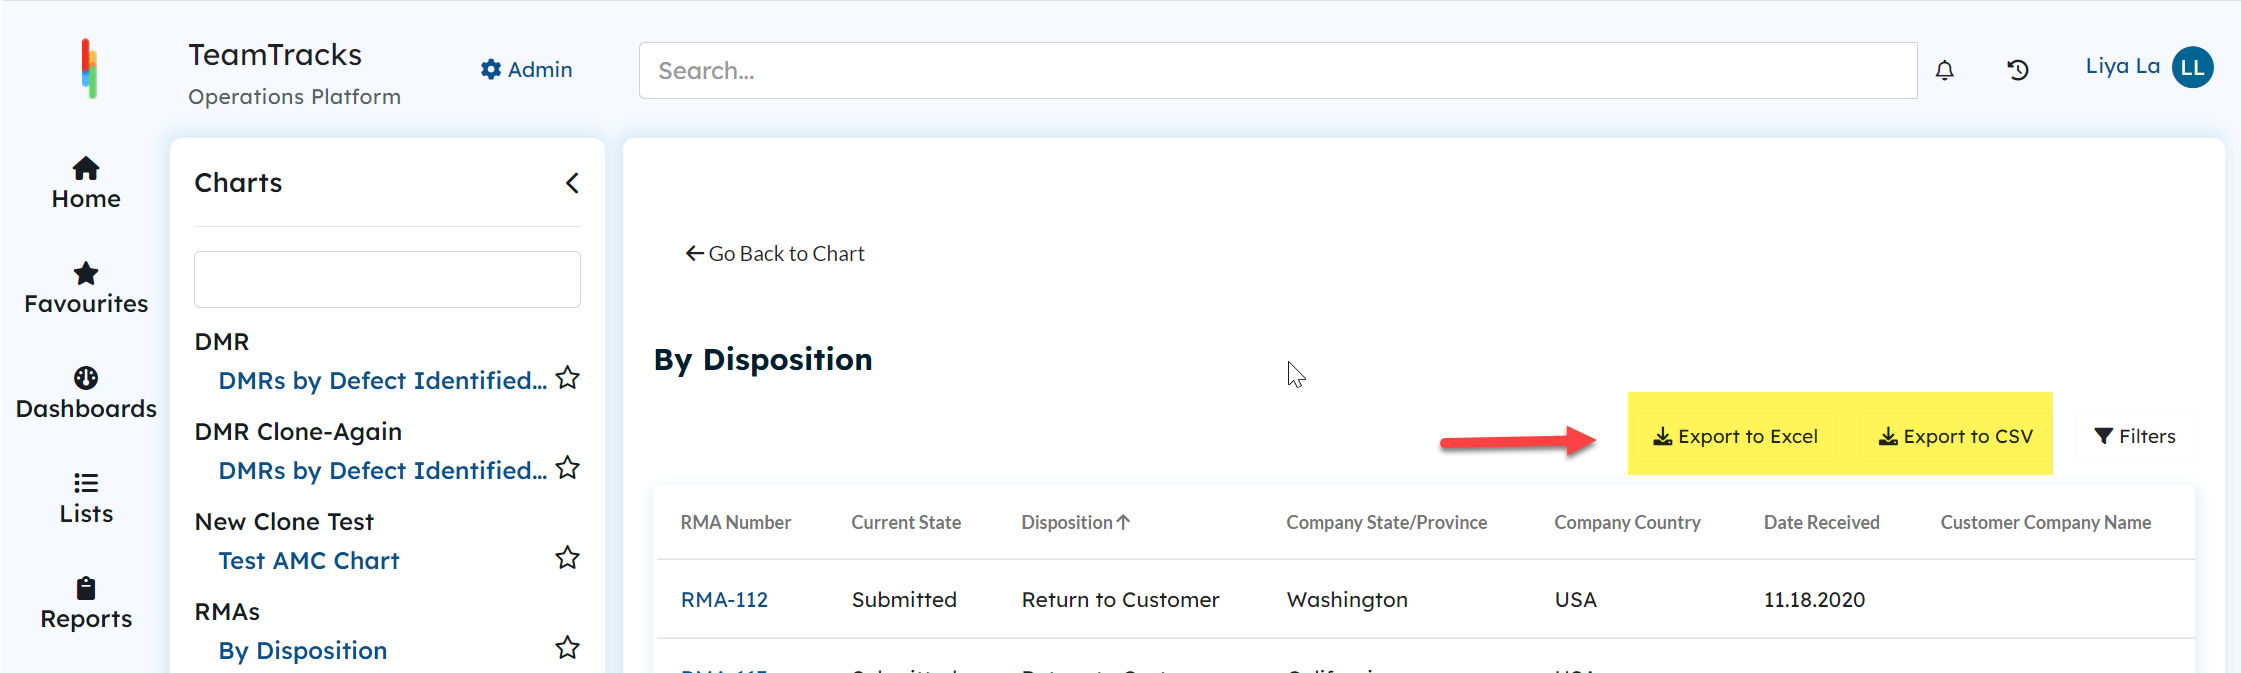
Agent Portal: Chart Detailed List View
Show Count
Turning on this feature will display the statistical value of each component in the graph.
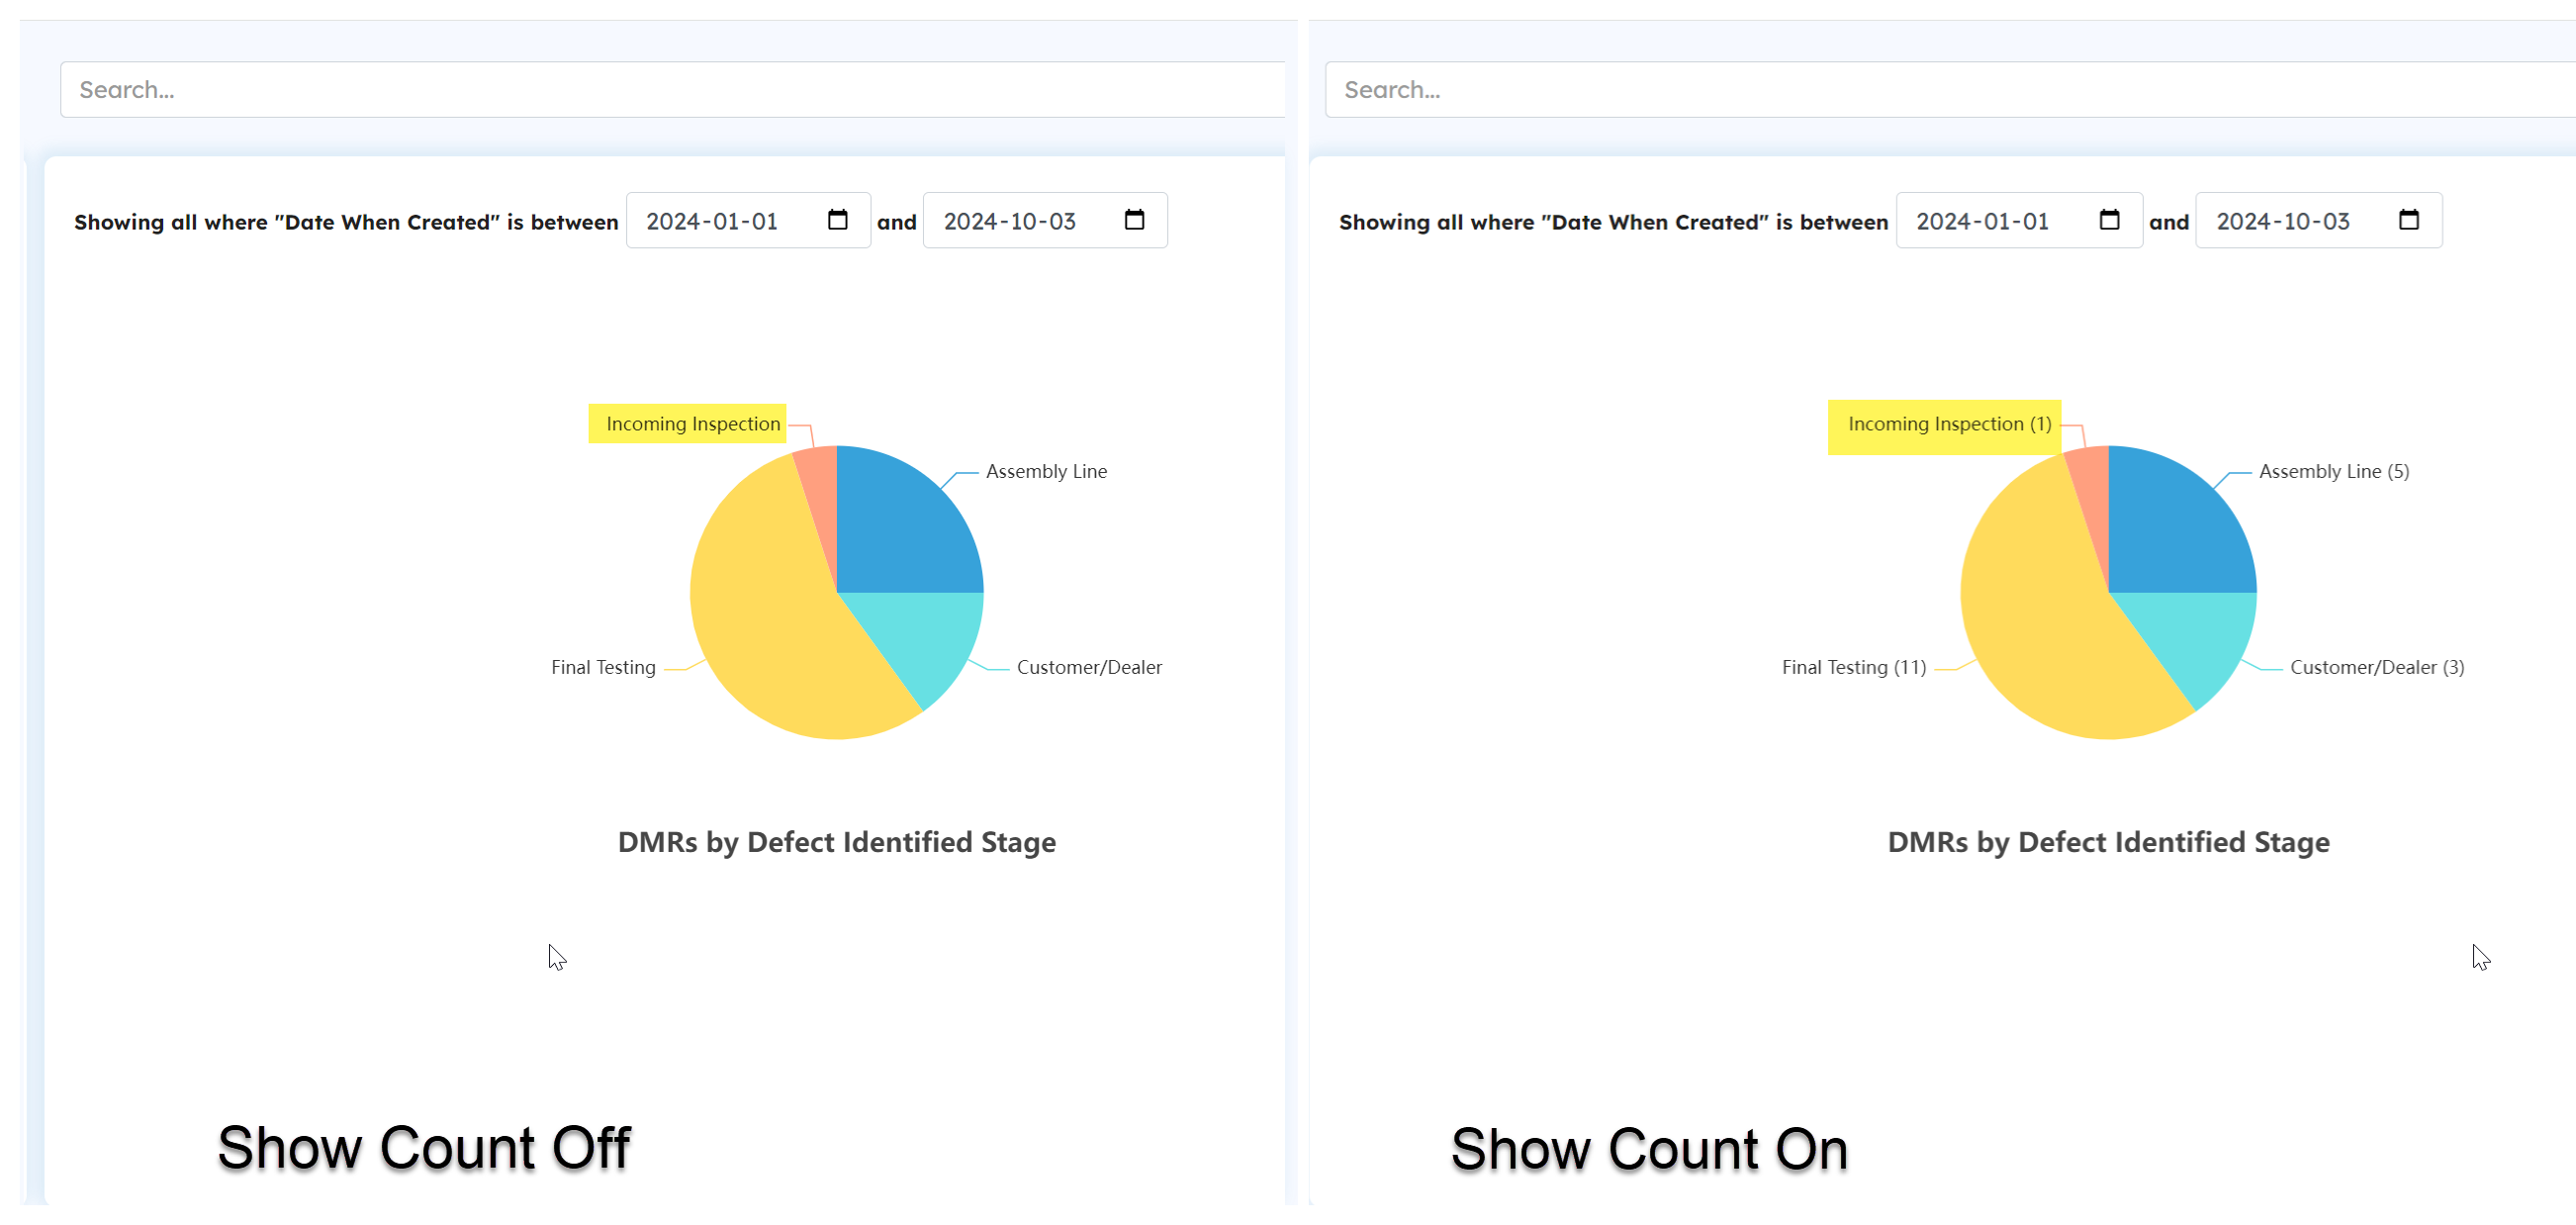
Agent Portal: Before and After of Show Count Feature in Charts