
Introduction
In this article, we will explore the capabilities of generating reports in TeamTracks. Reports are important and useful when it comes to summarizing and analyzing data effectively. They are also one of the ways to enable extraction of your data to be reused in other applications. They offer valuable insights that help business to make decisions based on reliable information.
With our reporting tool, you have the ability to export, print, apply filters, and view statistics. You can also customize which fields are displayed and control which user roles have access to the report.
Steps to Create a Report
- Login as Admin.
- Choose the track you want to work with.
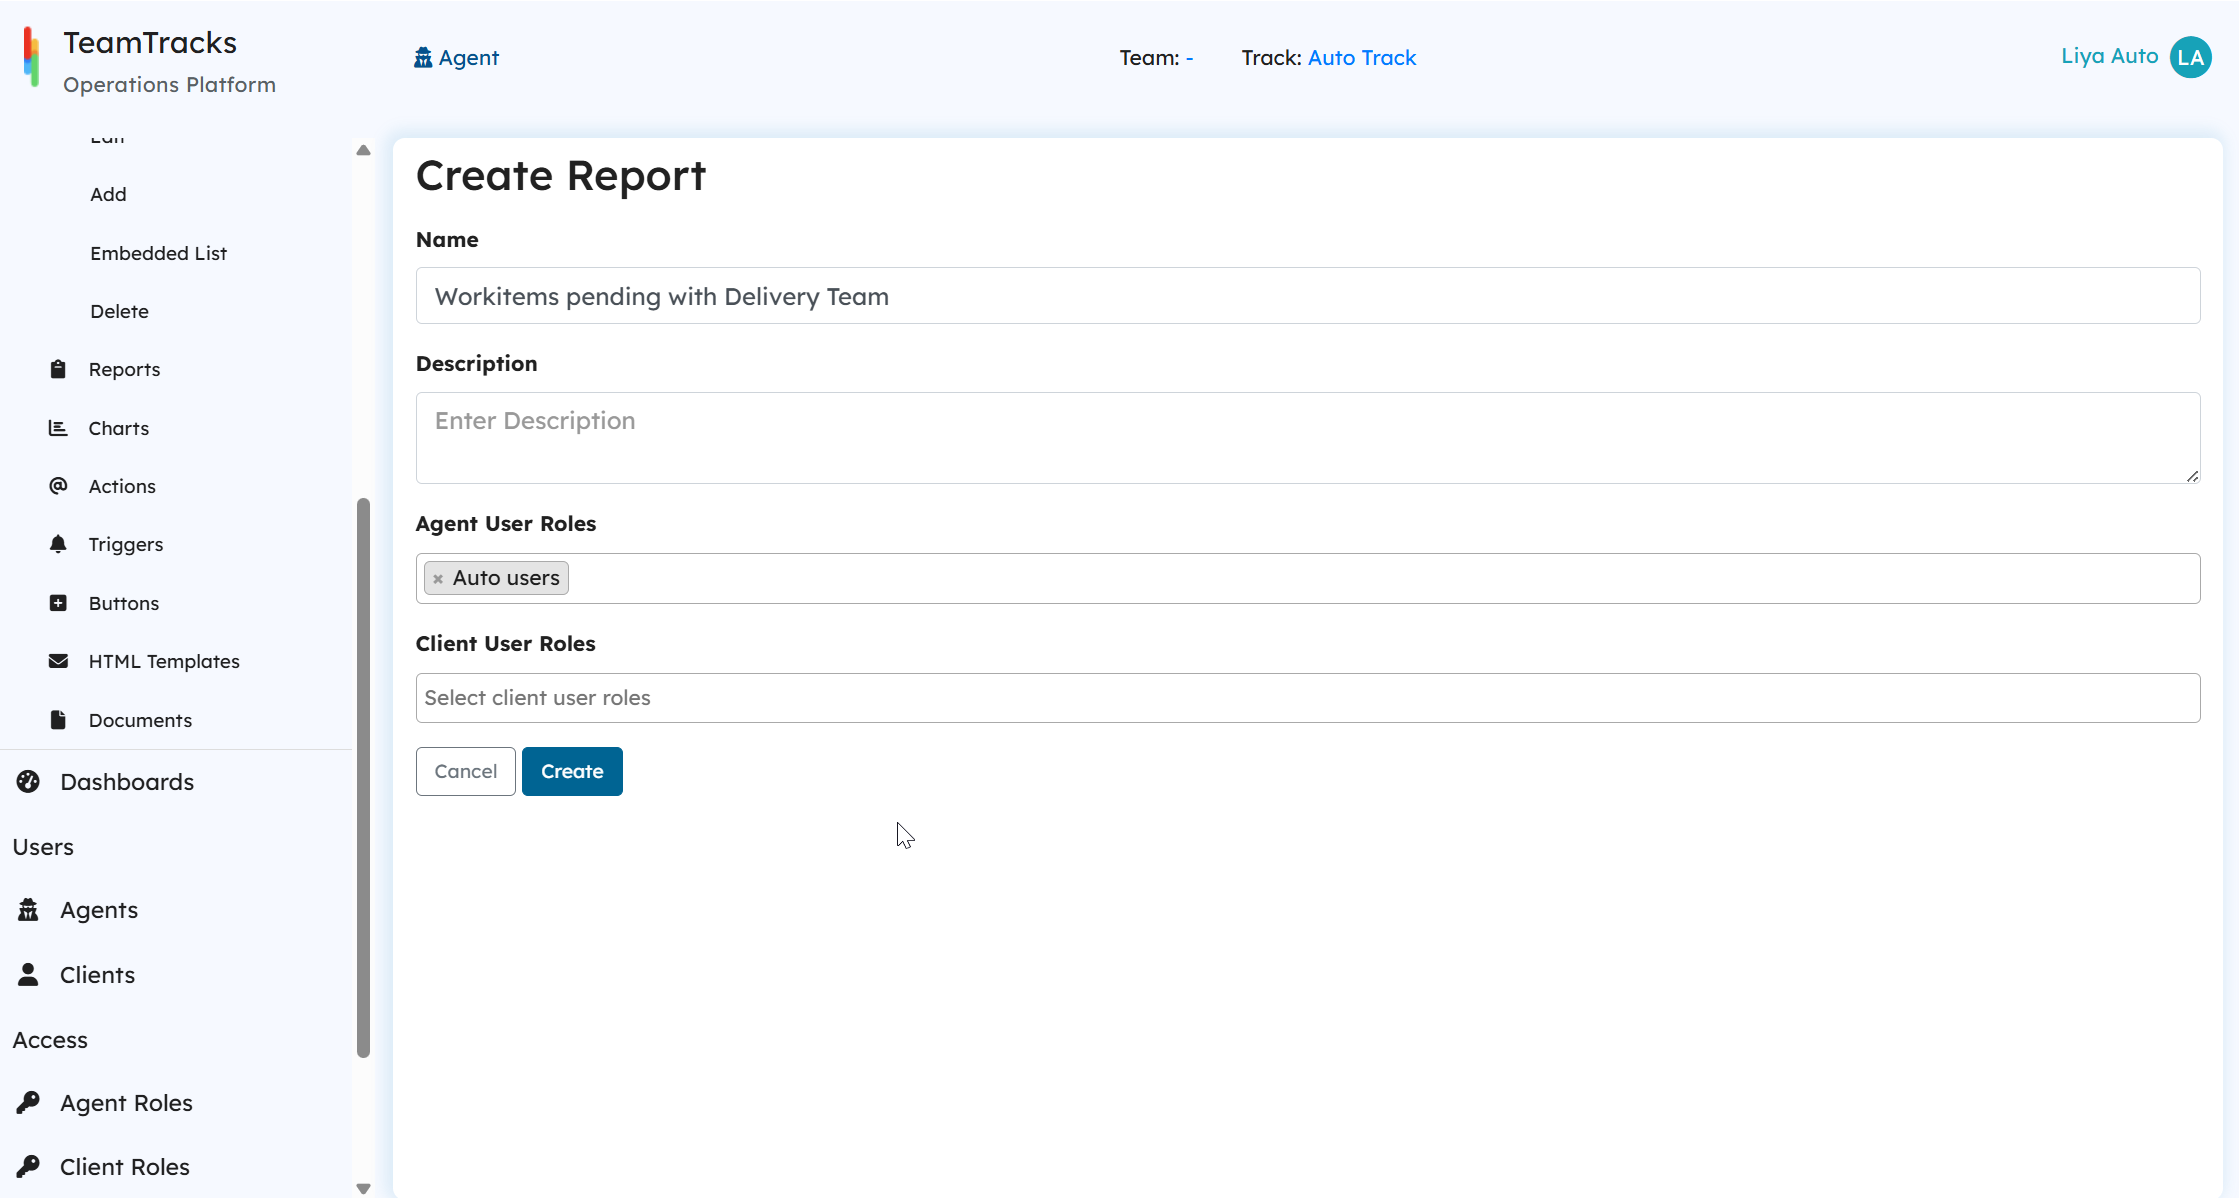
- Select Reports and Click on "Create New".
- Enter a Name and Description for your Report.
- Select the agent and client roles who need access to the report.
- Click on Create.
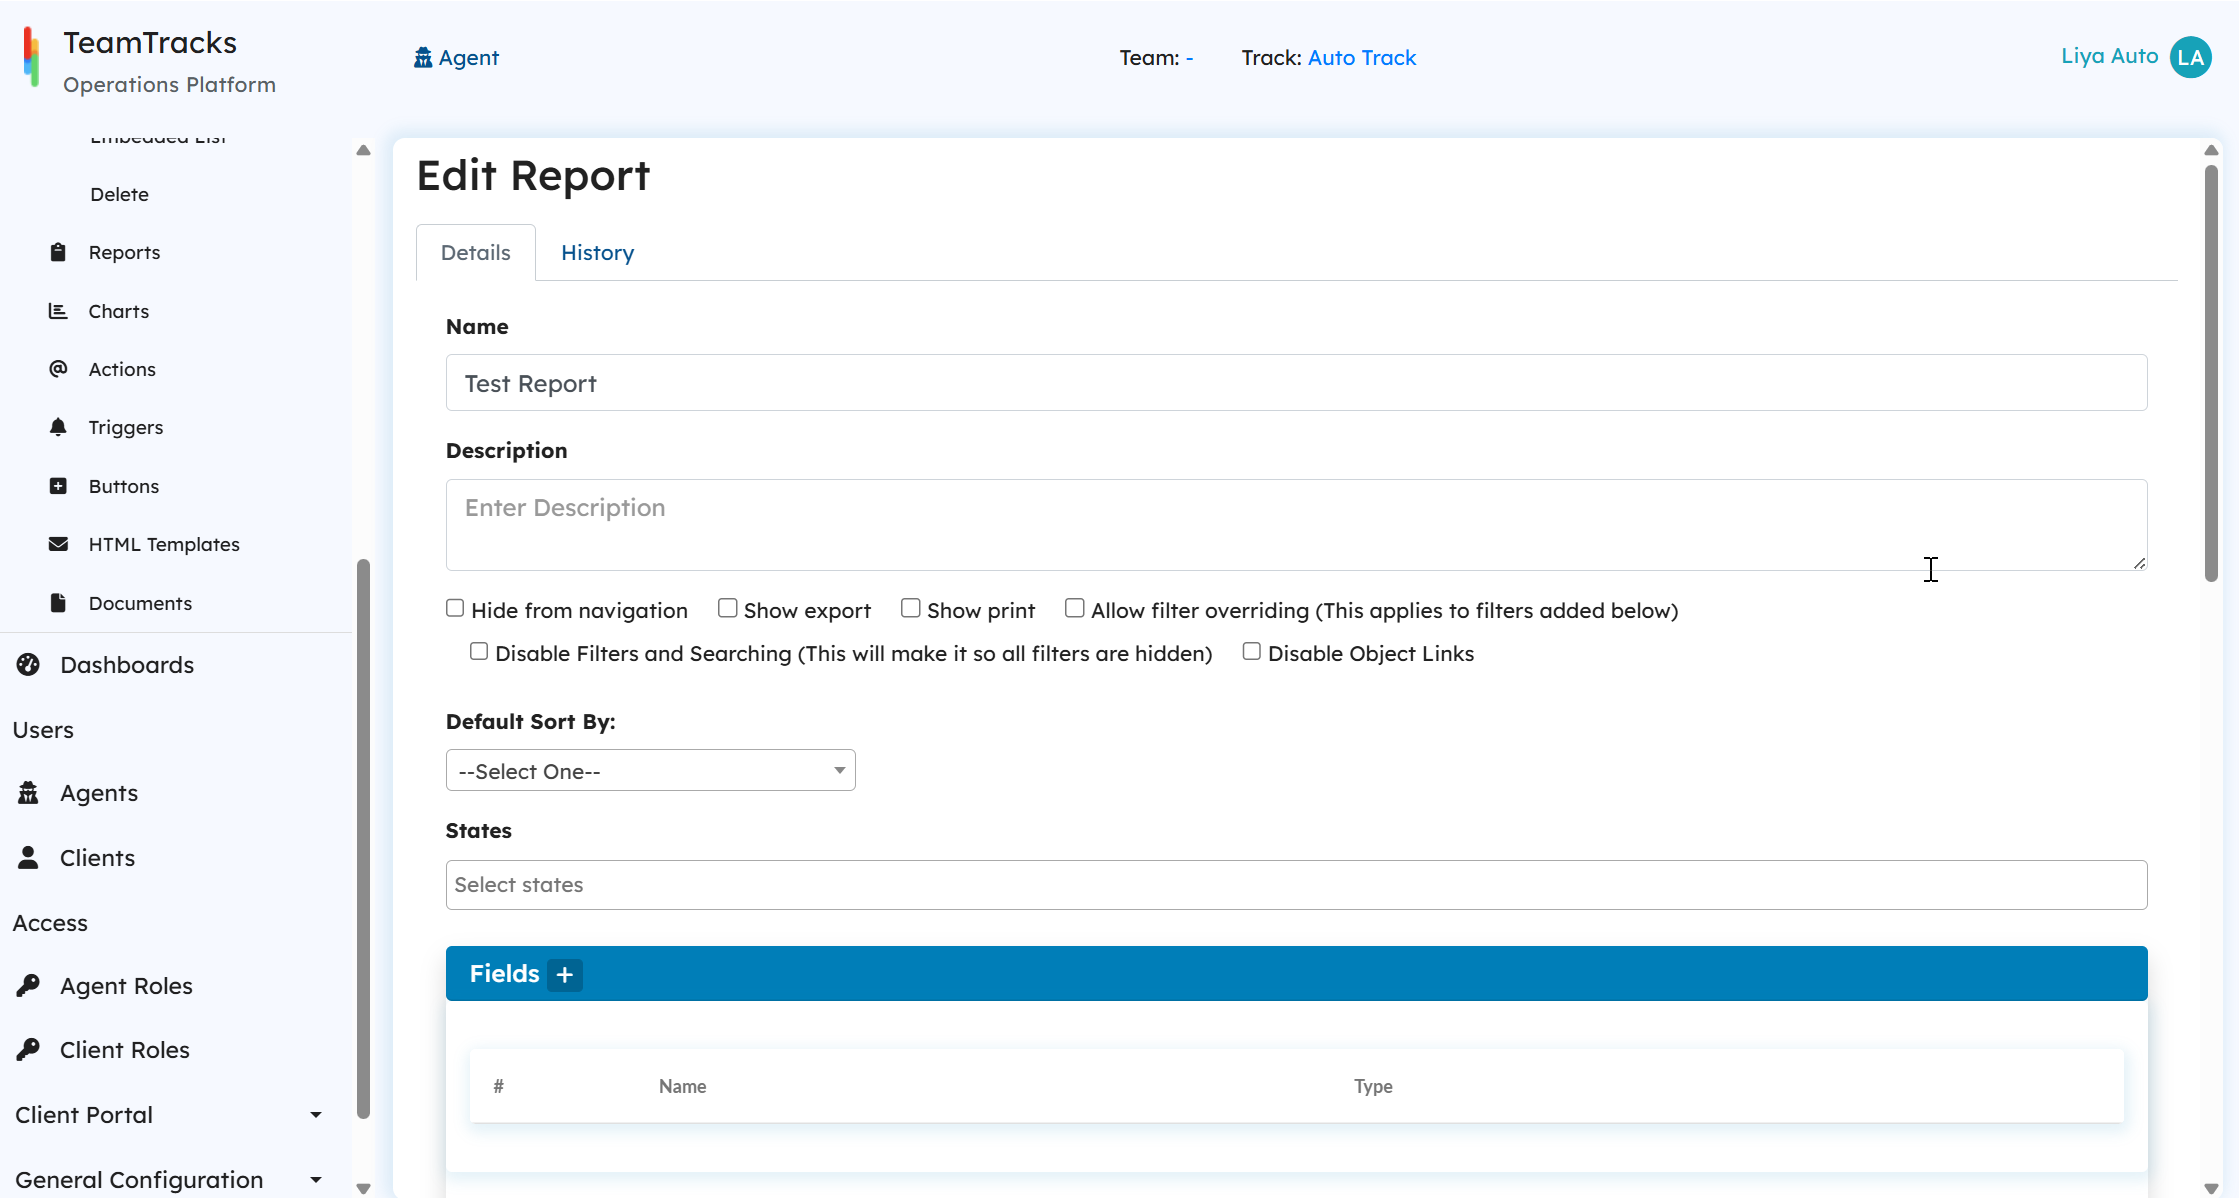
After successfully creating the new report, open it from the list to configure additional details.
- Enable specific features by checking the following checkboxes:
- Hide from navigation: Hide the report from the main left navigation bar on the Agent portal.
- Show export: Enable exporting the report into a file.
- Show print: Allow printing the report.
- Allow filter overriding: Enable the report to override existing filters, if any.
- Disable Object Links: Disable links preventing users from opening the object from the report.
- You can select the states(state of the object) for which the reports are being created. Only objects in the selected states will show up in the report. This is equivalent to setting a 'Current State' equals filter on the the report.
- Add Fields: Click on the "+" icon to add the fields you want to include in the report.
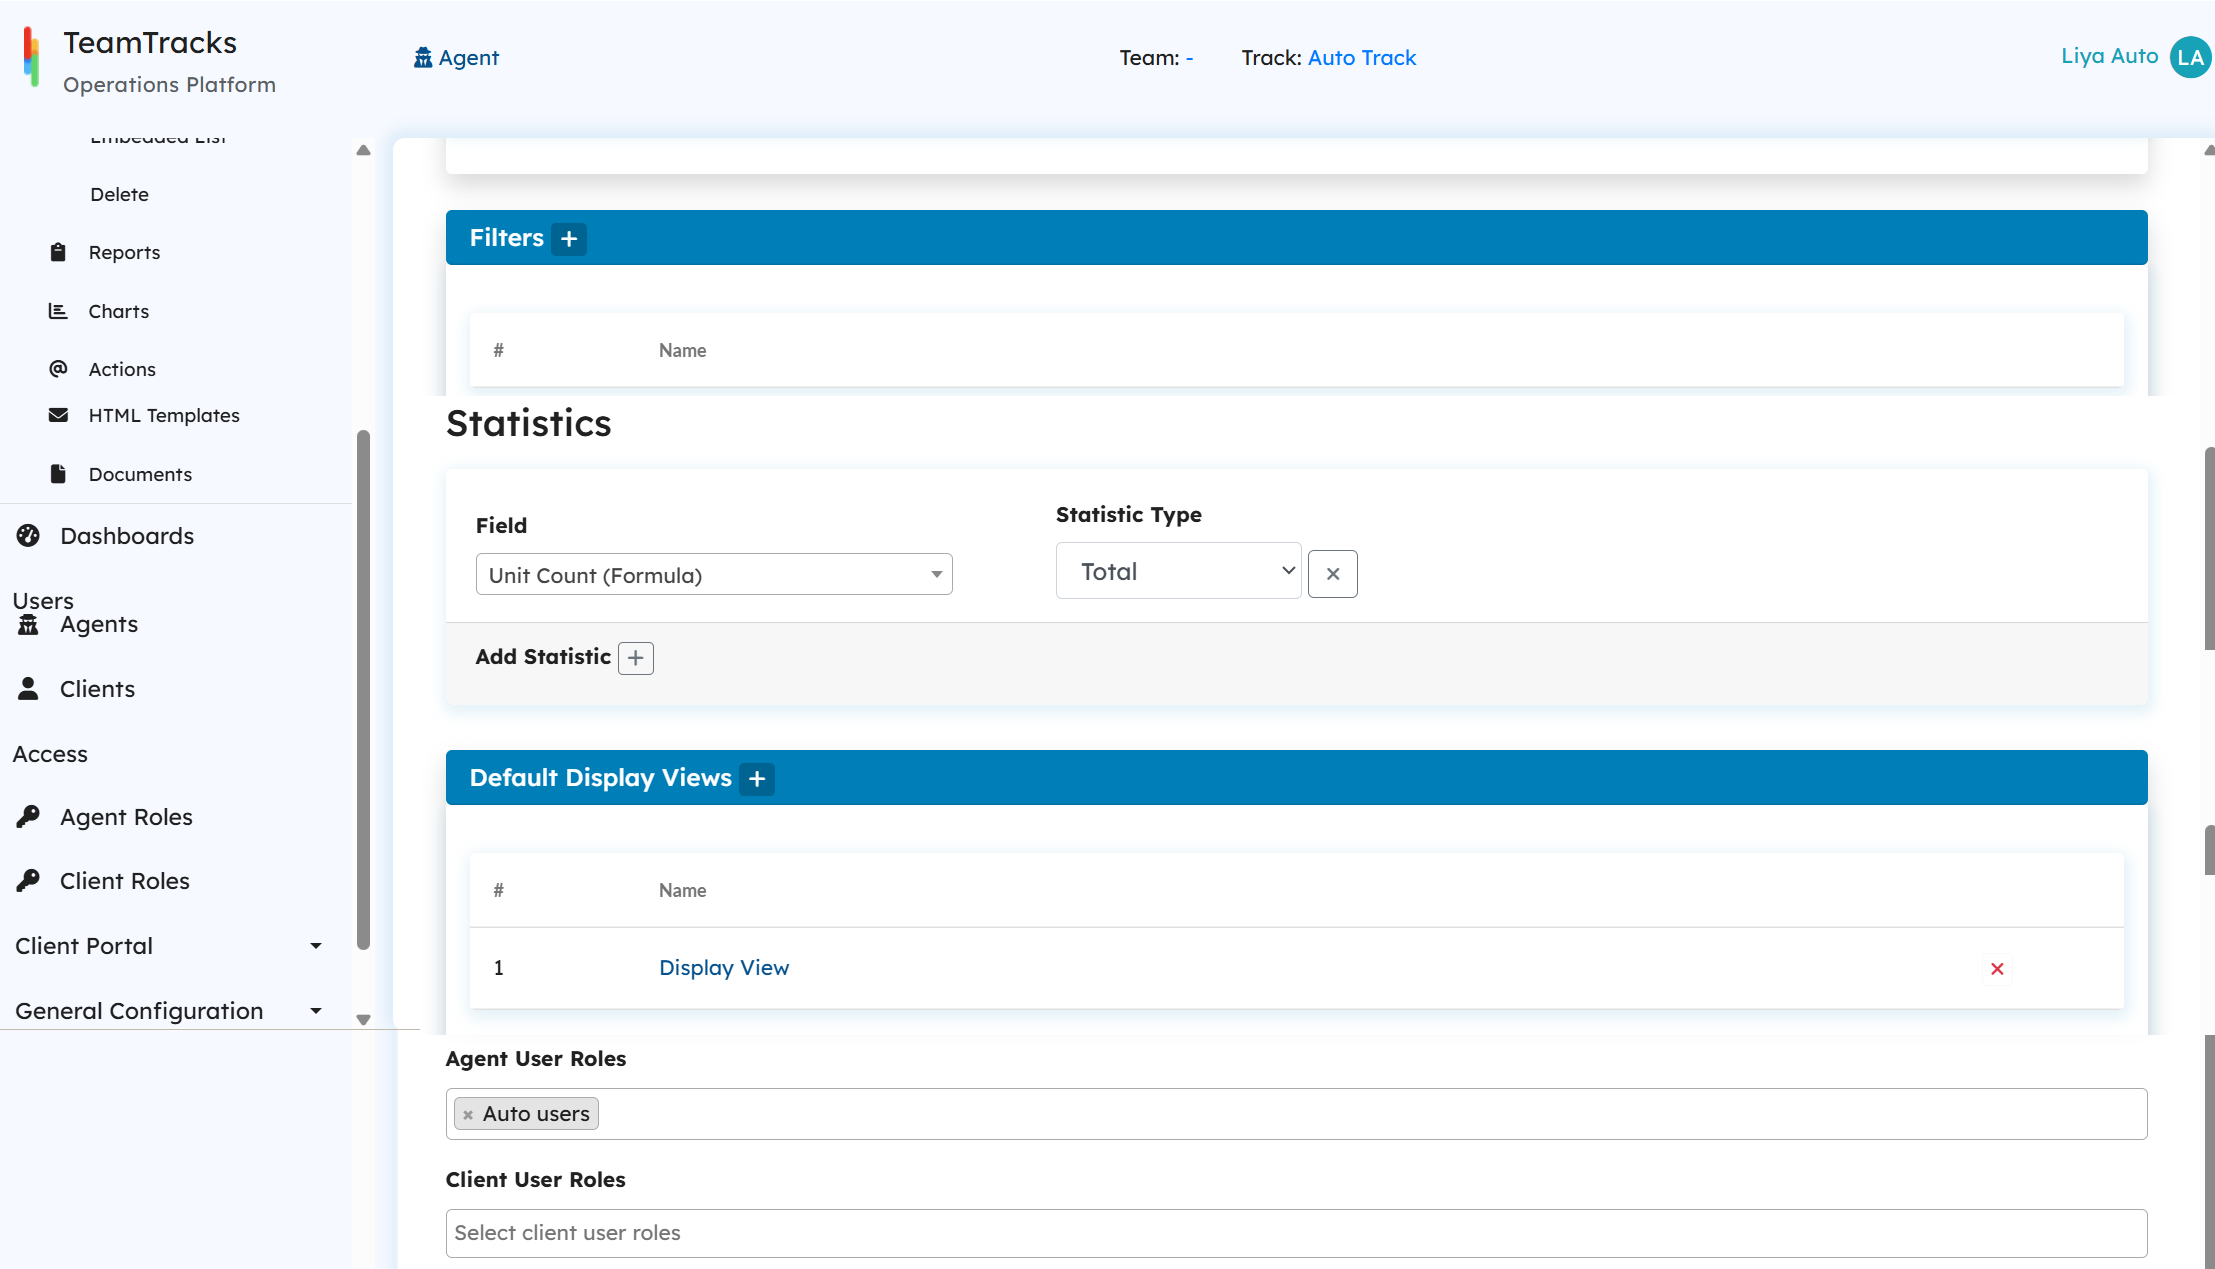
- Add Filters: Click on the "+" icon to add any filters to be applied to the report.
- Add Statistics: Click on the "+" icon to include statistics on different fields.
- For numeric data types, you can use Total and Average as statistic types.
- For text data types, the available statistic types are Count Equals, Count Not Equals, Count Contains, and Count Not Contains.
- Default Display Views: Associate display views within the reports. When a user opens an object from the report, the first accessible default view will be displayed. Any other views the user has access to will be available based on the ordering in the role. Click the + icon to include any display view available to be accessible from report.
- Click on the Save button to save your changes.
Here's how to access reports through Agent Portal:
- Log in to the agent portal.
- Navigate to the Left Navigation pane and select "Reports." This will display the available reports to you.
- Choose the specific report you want to access.
- If enabled, options such as printing and exporting will be available in the top-right corner of the report.
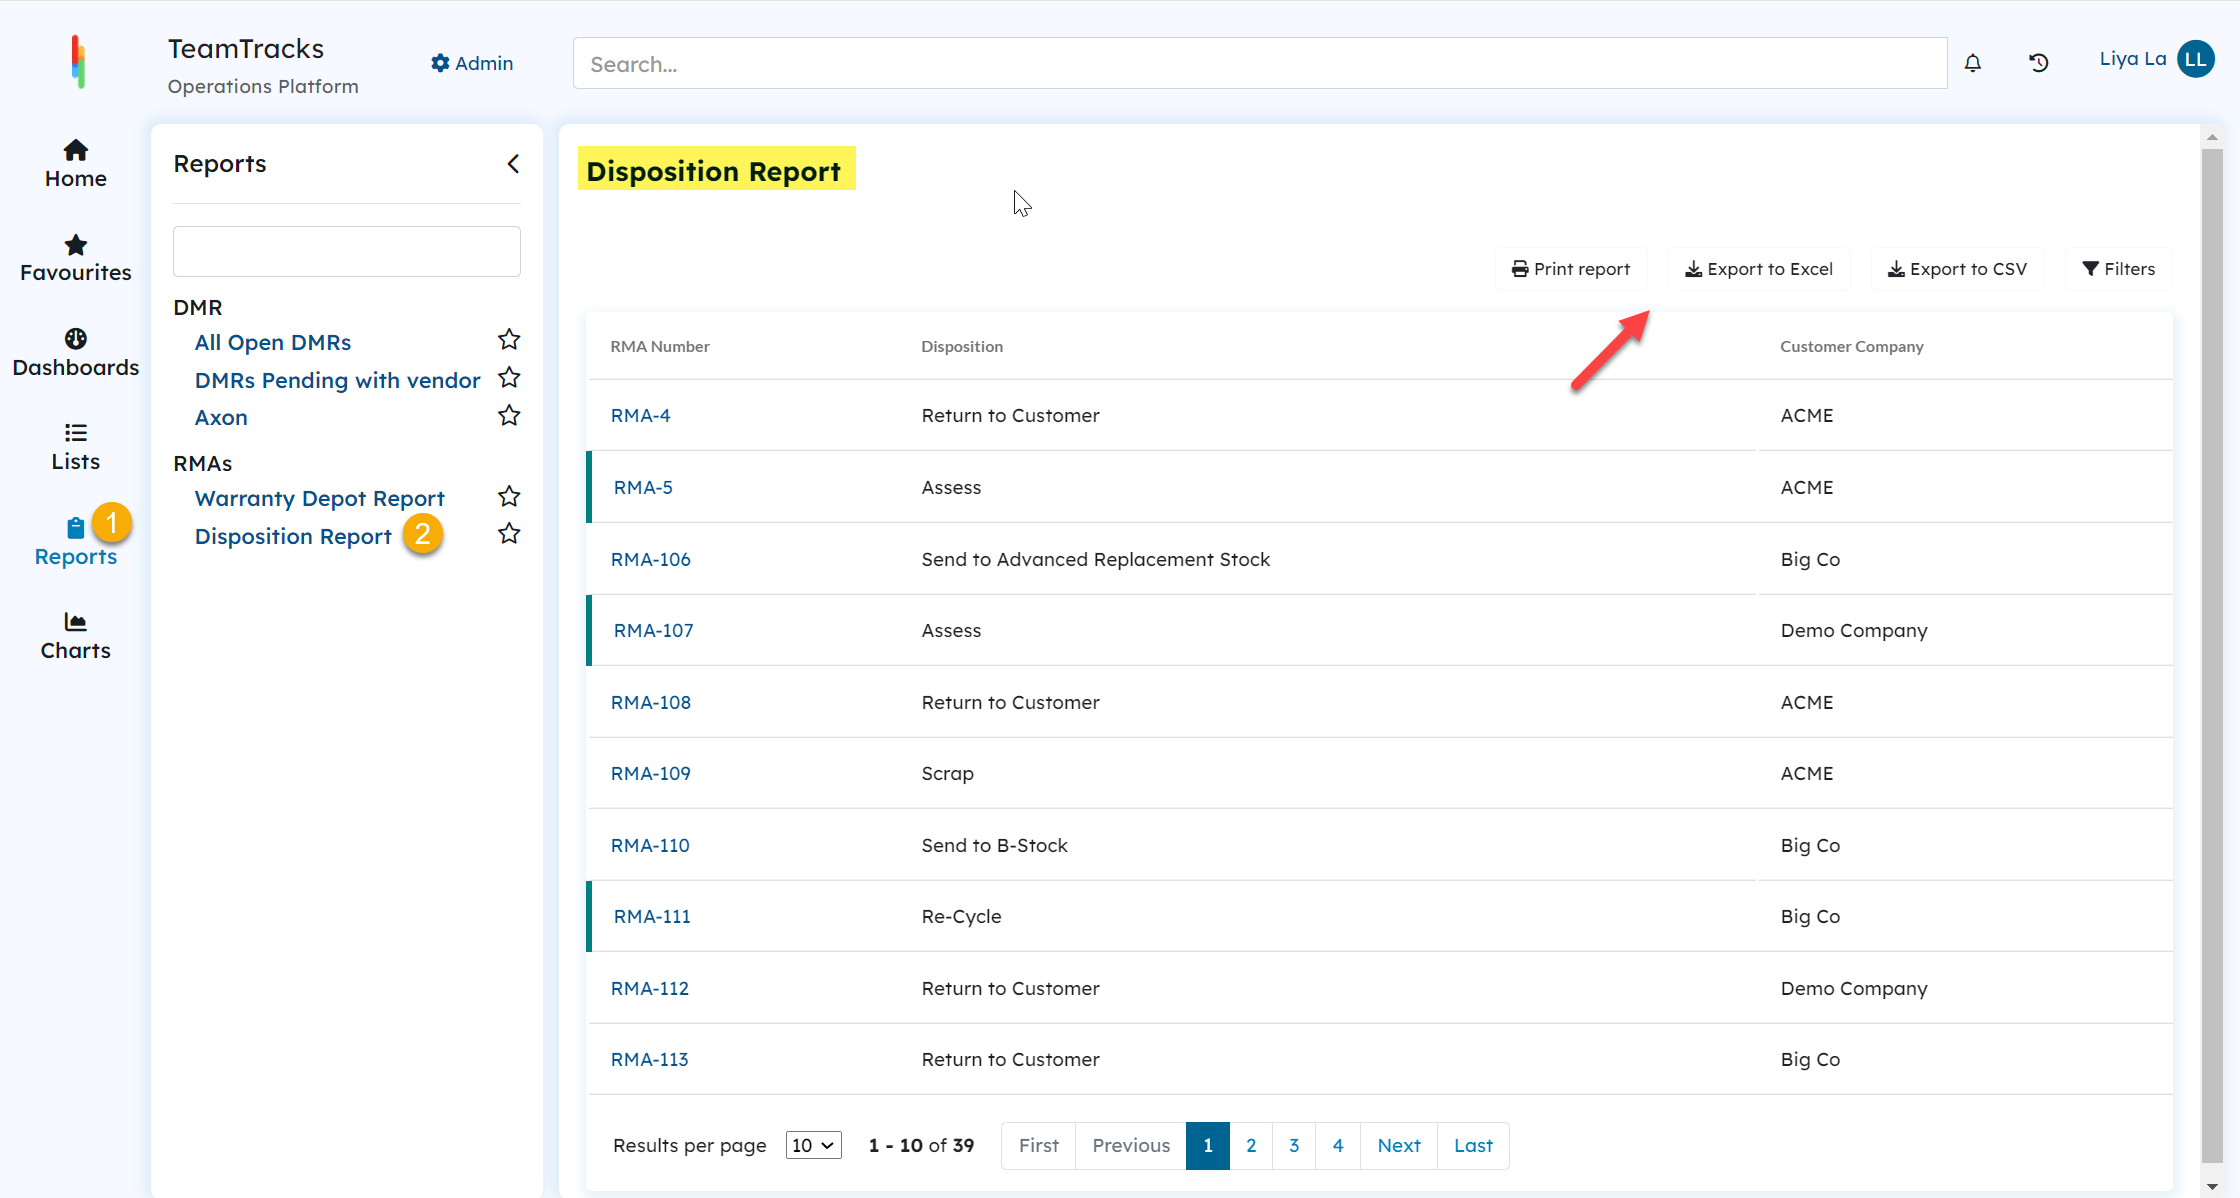 Agent Portal: Reports
Reports can be added to dashboards as well as Client portal pages.
Reports can be added to dashboards as well as Client portal pages.